One doesn't spend much time learning about climatology before coming across a marvelous sound bite: "Climate is what you expect, weather is what you get." The catch is it's not clear how to measure what you expect. We're a lot better at measuring weather.
The whole topic of measuring expectations deserves its own web page, as does the problem that we humans are pretty terrible at remembering weather, even extreme weather, and sometimes even recognizing extreme weather.
One way we define "normal" is that every ten years climatologists collect and average the previous thirty years of weather data, then release that as the "new normals." While that has a lot of shortcomings, and some are mentioned below, it all works out pretty well when comparing the "current normals" to the "current weather." However, when new normals are released, and are different than the old normals, confusion reigns for a while until the new normals get accepted. It's natural for people to compare the old with the new, but it's not as simple as it sounds. It may not even be a good idea.
What does it mean to compare our "old" normals from 1981-2010 to the "new" normals from 1991-2020? This table helps show a fundamental problem:
| Decade | old normal |
new normal |
Effect on comparison |
|---|---|---|---|
| 1981-1990 | Included | Removed | |
| 1991-2000 | Included | Included | None |
| 2001-2010 | Included | Included | None |
| 2011-2020 | Included | Added |
So when we compare these two 30 year periods, we're really just comparing the decade that started 40 years ago with the decade that started 10 years ago. While we can justify saying things like "over the last 30 years," that implies looking at a trend that covers a longer period. While that's often valid, it's not why we have 30 year normals. Perhaps it makes sense to compare the most recent decade with the one that started 40 years ago, but gee, that's not comparing two 30 year periods.
I conclude that a 30 year normal period is best used to compare to the weather we'll have over the next ten years.
Like I said, the release of new normals naturally invites a comparison to the old normals, and that's what the folks at the Mount Washington Observatory did. They teamed up with NH State Climatologist Mary Stampone and put on the webinar Science in the Mountains: The New Normal: Understanding the Newly Released 1991-2020 Climate Normals.
If you have time, it's worth watching. Dr. Stampone describes some of the trends around the state and refers to the very long and useful weather record from Concord NH. They look at the data from atop Mt. Washington (6288' above sea level and arguably home of the world's worst weather), the Pinkham Notch trailhead (2025' and home to much more benign weather), and a long time NWS Co-op site in North Conway (522' and operated by people tied to MWO).
I was very pleased to see, and not very surprised, that the North Conway site had much more warming than the others, but that's a topic for another web page. So are site locations. The North Conway site has had three moves, but apparently all three are close together. The Concord site is currently at the airport which certainly was not the case early on because there were no airports. I haven't bothered to hunt down the "metadata" for them (KCON), I don't think the changes are very significant.
I wrote Email to them pointing out more problems with their comparison of 30 year intervals. The most significant one is that while there was mention of increased tropical system activity, there was no mention of the effect of removing the 1981-1990 activity, a major flaw that was apparent to my view that they were merely comparing two decades. I explain why in much more detail in my Email.
  Date: Thu, 12 Aug 2021 13:17:16 -0400
  Subject: More comments on "The New Normal: Understanding the Newly Released
     1991-2020 Climate Normals"
  From: Ric Werme
  To: education@mountwashington.org, Mary Stampone
Hi,
I have a couple followup notes about the recent presentation on the 1981-2010 vs 1991-2020 "normals."
As I noted during the presentation, the comparison of the two periods is really the comparison of 1981-1990 and 2011-2020. I am extremely disappointed that I was the one to note that, but it does give me confidence that a retired software engineer can have a decent understanding of climatology.
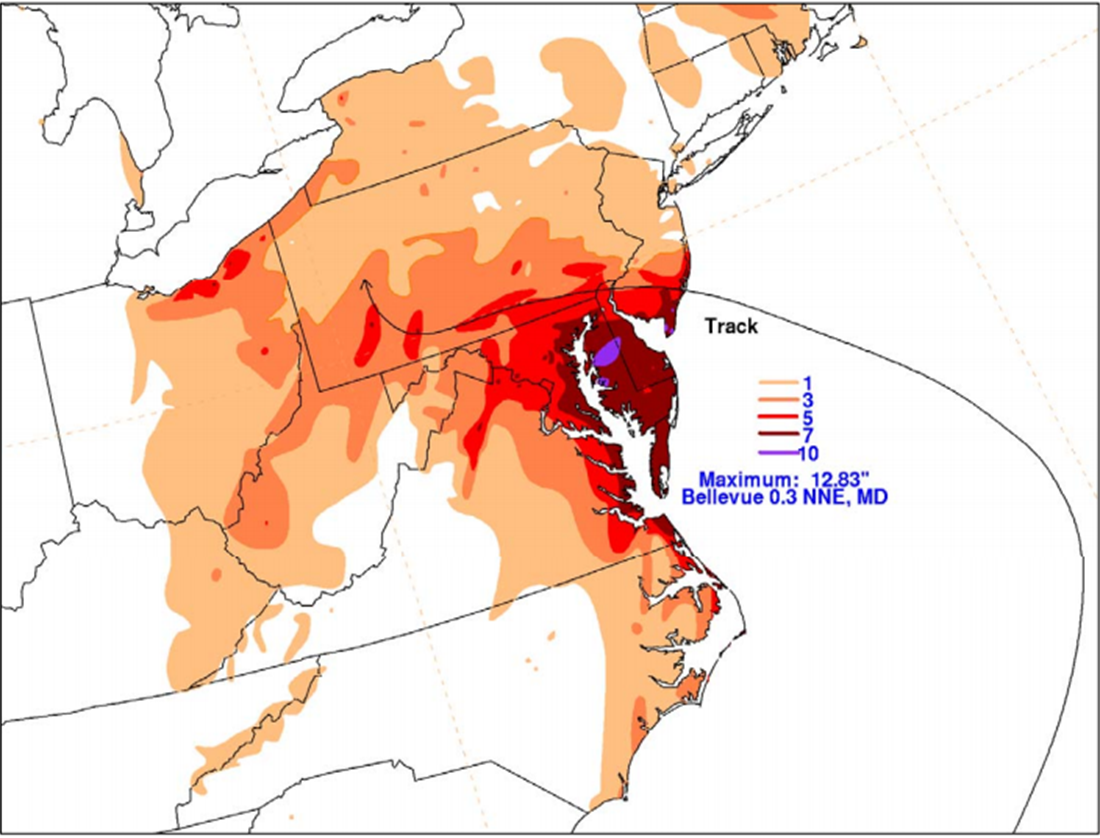
I heard a couple of references to Hurricane/Superstorm/extratropical Sandy regarding the higher October rainfall between the normals. That bothered me a lot at the time. Besides the forecasting and procedural issues with Sandy, a blocking high helped push Sandy westward, ultimately bringing upto 36" of wet snow to West Virgina and North Carolina.
Some storm summaries have rainfall maps that don't even show NH! E.g. this retrospective:
However, my Davis VP weather station in Boscawen saw rain in that period:
  mysql> select dt, lo_temp, hi_temp, rain from daily where dt >= '2012-10-28' and dt <= '2012-11-1';
  +------------+---------+---------+------+
  | dt         | lo_temp | hi_temp | rain |
  +------------+---------+---------+------+
  | 2012-10-28 |    47.4 |    55.7 | 0.00 |
  | 2012-10-29 |    51.0 |    60.4 | 1.10 |
  | 2012-10-30 |    52.2 |    67.4 | 0.97 |
  | 2012-10-31 |    46.8 |    56.7 | 0.02 |
  | 2012-11-01 |    42.9 |    52.9 | 0.00 |
  +------------+---------+---------+------+
www.mountwashington.org/uploads/forms/2012/10.pdf does report 5.76" from the event, partially estimated due to high winds on the 29th.
The rain we got may have been from an extratropical feeder band being forced over the blocking high:

So, I guess "Superstorm Sandy" counts for skewing the average, but let's note it was one weird storm and not indicative of a trend. Overall, I think the emphasis should be on nor'easters instead of tropical systems, as we have a lot more nor'easters and they impact a much larger area than the typical tropical cyclone.
Sticking with tropical storms a bit longer, some important ones for us in 2011-2020 include Irene, Isaias, and Zeta. Wikipdia's List of New England hurricanes lists twelve storms for that period.
There was no reference in the presentation to the the impact of losing the tropical storms of 1981-1990. That is just as important as those we gained in 2011-2020! The former period was during a negative phase AMO. Many people, starting with Bill Gray and his thermohaline circulation studies, note that there are fewer Atlantic tropical systems during the negative phase than during the positive phase. We entered the current positive phase in 1995 - a very busy tropical storm year. We are likely close to a flip back to the next negative phase. That may come with a repeat of our 1950s hurricanes. If so, I'm sure they'll be blamed on climate change and driving SUVs instead of history.
What did we lose from 1981-1990? That Wikipedia page lists only one storm, Hurricane Gloria in 1985. I was pretty close to it in Milford NH. Rain, blown down tree, lost power. The two nor'easters 7 1/2 years before were much more memorable.
It's my understanding that the 30-year climate normals are meant to be used to compare current conditions to "normal" weather. Given the pitfalls apparent in this presentation, I think that is about the only thing they are good for.
Of course, it's important to look at long term climatology, and that's one of the great things about KCON's long record. It's also important to realize that a 30 year period is actually the worst length when there are effects from the approximately 60 year cycles in the AMO and PDO. Longer cycles like one and two century solar-related cycles also need "respect" but are too long to compare against non-cyclic things like anthropogenic effects.
And then there's the 1930s. Dust Bowl, Hurricanes of 1935 and 1938, February 1934 (and repeated in February 2015 - record cold in Portland ME and KCON, and record warmth in Portland OR). It's no wonder that many longish term comparisons start in 1950!
-Ric Werme
Contact Ric Werme or return to his home page.
Written 2021 August 12.